


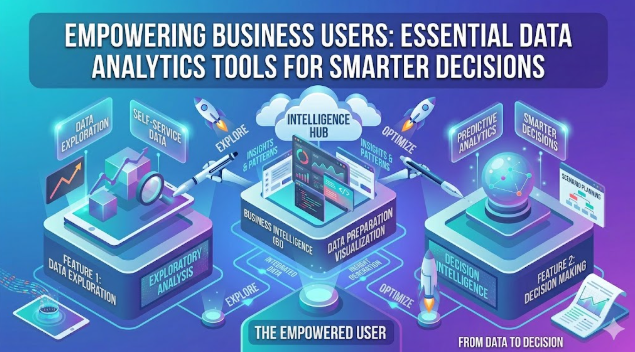
Empowering Business Users: Essential Data Analytics Tools for Smarter Decisions
In today’s competitive landscape, data is no longer just for specialized analysts. Business professionals across all departments increasingly need to understand and utilize data to drive strategic initiatives, optimize operations, and gain a competitive edge. The good news? You don’t need to be a data scientist or a programmer to harness the power of your business data. A new generation of intuitive, user-friendly data analytics tools puts powerful insights directly into the hands of business users.
This article explores essential data analytics tools designed to demystify data-driven decisions, enabling you to uncover trends, build compelling reports, and make informed choices with confidence, all without writing a single line of code.
Why Data Analytics Tools are Indispensable for Business Users
The ability to analyze data is no longer a luxury; it’s a fundamental skill that every forward-thinking business user benefits from. Here’s why these tools are becoming a cornerstone of modern business operations:
- Improved Decision-Making: Data analytics provides objective insights into performance, customer behavior, and market trends, allowing for evidence-based decisions rather than relying on intuition alone.
- Identifying Trends and Opportunities: By visualizing data, business users can quickly spot emerging patterns, forecast future outcomes, and identify untapped market opportunities or potential risks.
- Enhanced Operational Efficiency: Analyzing operational data can reveal bottlenecks, inefficiencies, and areas for improvement, leading to streamlined processes and cost savings.
- Gaining a Competitive Advantage: Understanding customer preferences, market shifts, and competitor strategies through data analysis allows businesses to innovate faster and respond more effectively.
- Democratizing Data Access: These tools break down silos, making data accessible and understandable across different departments, fostering a more collaborative and data-aware culture.
Key Features to Look for in Business-Friendly Data Analytics Tools
When evaluating data analytics tools for business users, focus on features that prioritize ease of use, accessibility, and actionable insights. Look for the following:
- Intuitive User Interface (UI): A clean, well-organized interface that requires minimal training to navigate.
- Drag-and-Drop Functionality: The ability to easily manipulate data fields, create visualizations, and build dashboards without coding.
- Pre-built Templates and Dashboards: Ready-to-use templates for common business scenarios (e.g., sales performance, marketing campaigns, financial reporting) that can be customized.
- Easy Data Integration: Seamless connectivity with various data sources, including spreadsheets, cloud databases, CRM systems, and marketing platforms.
- Robust Visualization Capabilities: A wide range of chart types (bar, line, pie, scatter, geographical maps) to effectively communicate insights.
- Collaboration Features: The ability to share reports, dashboards, and insights with colleagues, often with commenting and version control.
- Scalability and Support: Tools that can grow with your business needs and offer reliable customer support and community resources.
Top Data Analytics Tools for Business Users
Here are some of the leading data analytics tools specifically designed with business users in mind:
Microsoft Power BI
Microsoft Power BI is a powerful suite of business intelligence tools that excel at connecting to diverse data sources, transforming data, and creating interactive reports and dashboards. Its deep integration with the Microsoft ecosystem (Excel, Azure, SharePoint) makes it a natural fit for many organizations. Power BI Desktop is free, offering robust capabilities for individual users, while Pro and Premium versions cater to broader organizational needs for sharing and collaboration.
- Key Strengths: Excellent data connectivity, powerful data modeling, interactive dashboards, strong community support, familiarity for Excel users.
- Ideal For: Businesses already using Microsoft products, those needing robust reporting and data visualization, and users comfortable with an Excel-like interface.
- Learn More: powerbi.microsoft.com
Tableau Public / Tableau Desktop
Renowned for its stunning visualizations and user-friendly interface, Tableau has long been a favorite among data enthusiasts. Tableau Public allows anyone to create and share interactive data visualizations online for free, making it an excellent starting point for learning. Tableau Desktop offers more comprehensive features for private data analysis and reporting. Its drag-and-drop interface makes complex data exploration accessible to all.
- Key Strengths: Industry-leading data visualization, highly interactive dashboards, strong community and learning resources, fast performance.
- Ideal For: Users prioritizing aesthetic and highly interactive data storytelling, and those who need powerful exploratory data analysis.
- Learn More: tableau.com/products/public
Google Looker Studio (formerly Google Data Studio)
Google Looker Studio is a free, web-based tool that enables users to create highly customized, interactive dashboards and reports. It integrates seamlessly with Google’s marketing and analytics products like Google Analytics, Google Ads, Google Sheets, and YouTube. Its intuitive drag-and-drop interface makes it incredibly accessible for marketing professionals and small business owners looking to visualize their data.
- Key Strengths: Free to use, excellent integration with Google services, collaborative features, easy sharing of reports.
- Ideal For: Marketing teams, small to medium businesses, and anyone heavily invested in the Google ecosystem for their data.
- Learn More: lookerstudio.google.com
Zoho Analytics
Zoho Analytics is a robust self-service business intelligence and data analytics software that allows users to create insightful reports and dashboards from various data sources. As part of the broader Zoho ecosystem, it integrates effortlessly with other Zoho applications but also offers extensive connectors to third-party apps, databases, and files. It’s particularly appealing for its competitive pricing and comprehensive feature set suitable for small to medium-sized businesses.
- Key Strengths: Affordable, broad data integration, good for SMBs, strong embedded analytics options.
- Ideal For: Businesses looking for an all-in-one analytics solution, particularly those already using Zoho products.
- Learn More: zoho.com/analytics
Qlik Sense
Qlik Sense is known for its unique associative engine, which allows users to explore data freely and discover hidden insights without the limitations of query-based tools. It offers intelligent visualizations and a user-friendly interface that adapts to various devices. Qlik Sense focuses on interactive dashboards and guided analytics, empowering users to ask and answer their own questions from the data.
- Key Strengths: Associative engine for deep data exploration, smart visualizations, mobile-first design, governed self-service.
- Ideal For: Organizations that need to enable extensive data exploration and discovery across all levels, moving beyond static reports.
- Learn More: qlik.com/us/products/qlik-sense
How to Choose the Right Tool for Your Business
Selecting the best data analytics tool requires careful consideration of your specific needs:
- Define Your Goals: What specific business questions do you need to answer? What kind of reports and insights are most critical?
- Assess Your Data Sources: Where is your data located (CRM, ERP, spreadsheets, cloud apps)? Ensure the tool can easily connect to all your relevant sources.
- Consider Your Team’s Skill Level: Opt for tools with a shallower learning curve if your team is new to data analytics.
- Budget Considerations: Factor in licensing costs, potential training expenses, and any infrastructure requirements. Many tools offer free trials or freemium versions.
- Scalability Needs: Choose a tool that can grow with your business, handling increasing data volumes and user numbers.
- Trial Periods and Demos: Always take advantage of free trials or request demos to see how the tool performs with your actual data and use cases.
Implementing Data Analytics: Best Practices for Business Users
Adopting data analytics successfully involves more than just picking a tool. Here are some best practices:
- Start Small, Scale Up: Begin with a specific project or department to demonstrate value before rolling out across the entire organization.
- Train Your Team: Invest in training to ensure users are proficient and confident in using the chosen tool. Many platforms offer excellent online resources and tutorials.
- Foster a Data-Driven Culture: Encourage experimentation, critical thinking, and a willingness to question assumptions based on data insights.
- Regularly Review and Refine: Data needs and business objectives evolve. Periodically review your dashboards and reports to ensure they remain relevant and actionable.
Frequently Asked Questions About Data Analytics Tools
Q: What’s the difference between business intelligence (BI) and data analytics?
A: While often used interchangeably, business intelligence (BI) typically focuses on descriptive analytics – what happened in the past – using dashboards and reports to monitor current performance. Data analytics is a broader term encompassing descriptive, diagnostic (why it happened), predictive (what will happen), and prescriptive (what should be done) analytics. Tools often overlap, providing capabilities for both BI and deeper data analysis.
Q: Do I need a data science background to use these tools?
A: Absolutely not. The tools highlighted in this article are specifically designed for business users without coding or advanced statistical knowledge. They use visual interfaces, drag-and-drop functionalities, and pre-built templates to make data analysis accessible to everyone.
Q: How long does it take to get proficient with these tools?
A: Basic proficiency can often be achieved in a few days or weeks of dedicated practice. Creating simple reports and dashboards is usually straightforward. Mastering advanced features and complex data modeling will naturally take longer, but the core functionality is designed for rapid adoption.
Q: Are there reliable free data analytics tools for business users?
A: Yes, several excellent free options exist. Google Looker Studio is completely free, and Microsoft Power BI Desktop has a free version. Tableau Public also offers a free way to learn and create visualizations, though data must be publicly sharable. These are great starting points for individuals and small teams.
Q: What kind of data can I analyze with these tools?
A: You can analyze a vast array of data types, including sales data, marketing campaign performance, customer demographics, website traffic, financial records, operational metrics, supply chain data, and much more. Most tools connect to various sources like Excel spreadsheets, CSV files, cloud databases, CRM systems, ERPs, and popular marketing platforms.
Embrace Data-Driven Decisions
The era of data gatekeepers is fading. With the advent of user-friendly data analytics tools, business professionals are empowered to explore, understand, and leverage their data like never before. By embracing these essential tools, you can move beyond guesswork, make more informed decisions, and steer your business toward greater success. Start exploring the options today and unlock the immense potential hidden within your data.
Category: DATA SCIENCE & ANALYTICS
Tags: Data Analytics, Business Intelligence, Business Tools, Data-Driven Decisions, No-Code Analytics, Power BI, Tableau, Looker Studio